8.9 结构柱状图 EMP_structure_plot
结构图主要用于展现数据内Top特征的相对含量。例如,在微生物组学数据中,可以根据前10位菌种的相对丰度来展示样本内微生物的主要组成情况。
8.9.1 物种结构图
微生物数据经常需要绘制物种结构图。
注意:
①内置的色板提供了15种颜色,最多可指定绘制前15位特征。当需要绘制更多的特征时,需要通过设置参数
②参数
①内置的色板提供了15种颜色,最多可指定绘制前15位特征。当需要绘制更多的特征时,需要通过设置参数
palette指定更多种类的色板。②参数
method可以指定根据数据的平均值、中位数、最大值或者最小值来选择Top特征。
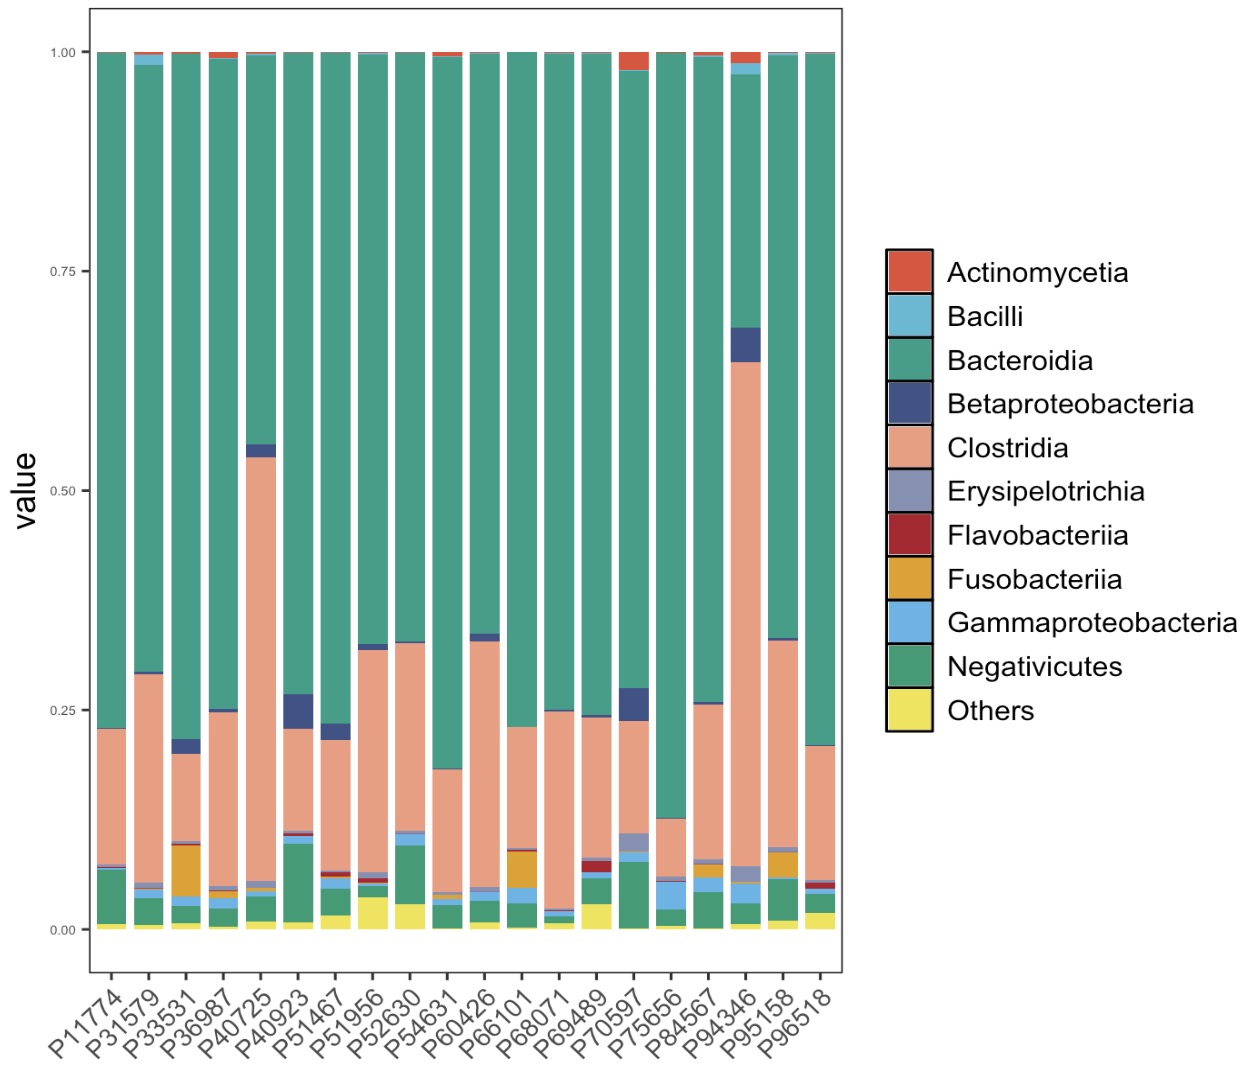
🏷️示例1:绘制纲级别物种丰度前10名的相对丰度结构图。
MAE |>
  EMP_assay_extract('taxonomy') |>
  EMP_decostand(method = 'relative') |>
  EMP_collapse(estimate_group = 'Class',collapse_by = 'row') |>
  EMP_structure_plot(top_num=10)
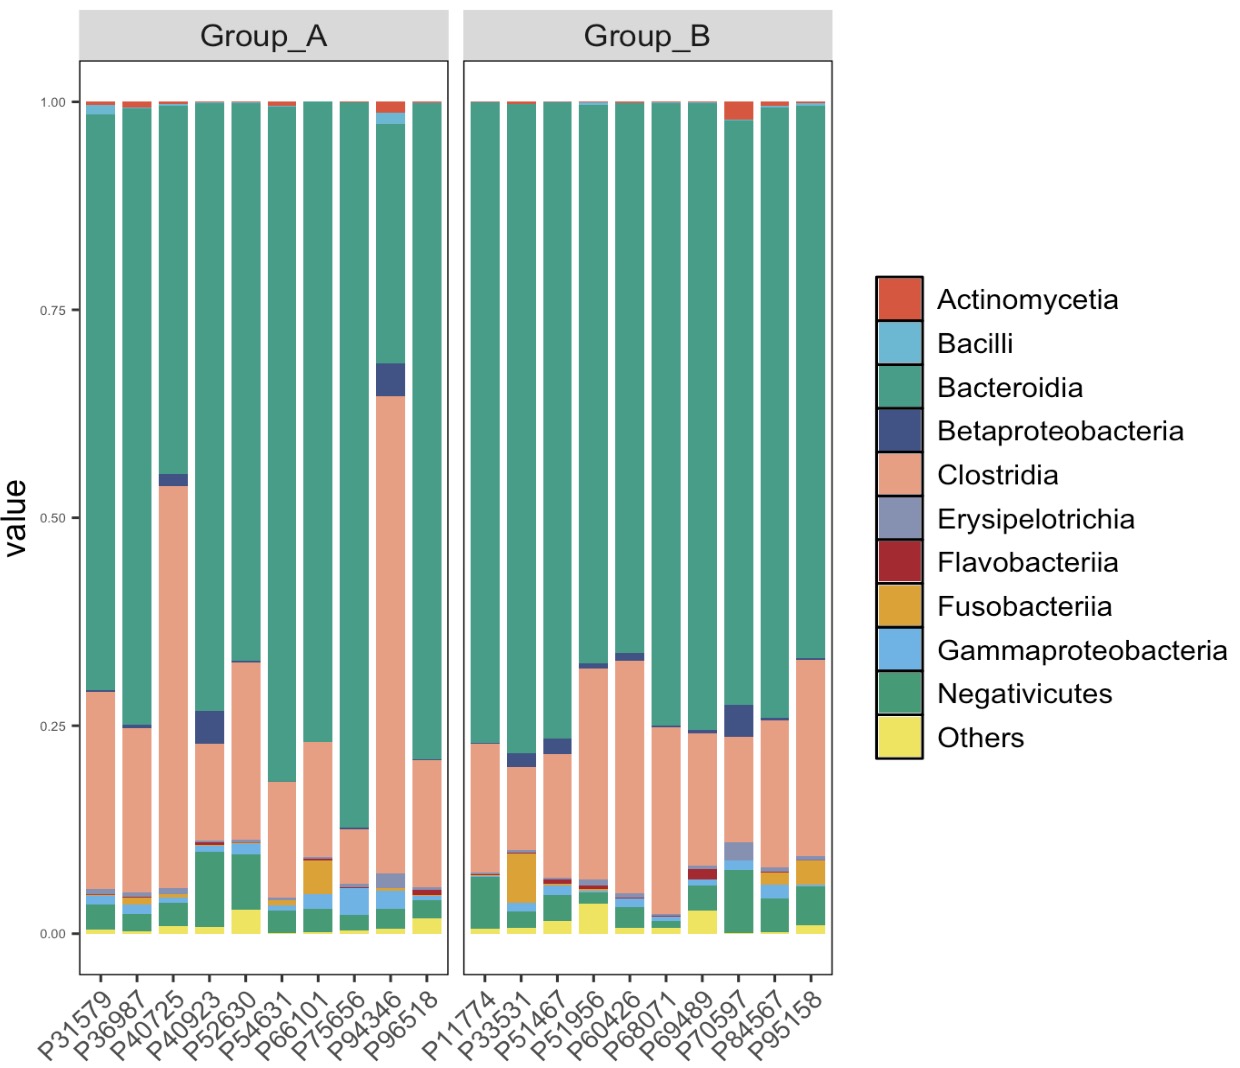
🏷️示例2:利用参数estimate_group设置分组,并绘制物种结构图。
MAE |>
  EMP_assay_extract('taxonomy') |>
  EMP_decostand(method = 'relative') |>
  EMP_collapse(estimate_group = 'Class',collapse_by = 'row') |>
  EMP_structure_plot(top_num=10,estimate_group='Group')
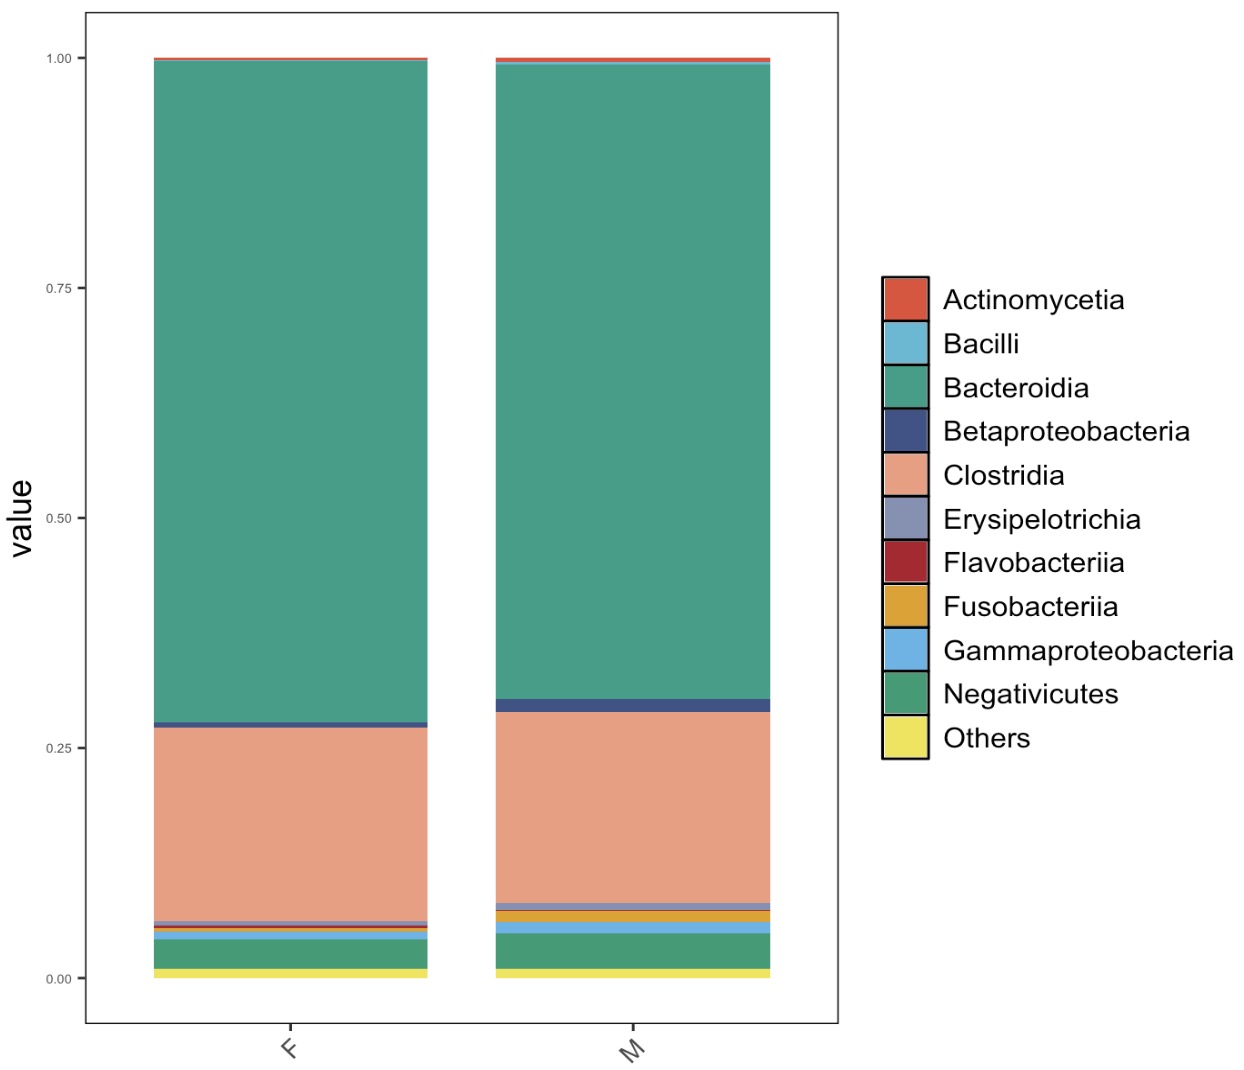
🏷️示例3:先按照Sex折叠assay,再绘制分组的物种结构图。
MAE |>
  EMP_assay_extract('taxonomy') |>
  EMP_collapse(estimate_group = 'Sex',collapse_by = 'col') |>
  EMP_decostand(method = 'relative') |>
  EMP_collapse(estimate_group = 'Class',collapse_by = 'row') |>
  EMP_structure_plot(top_num=10)
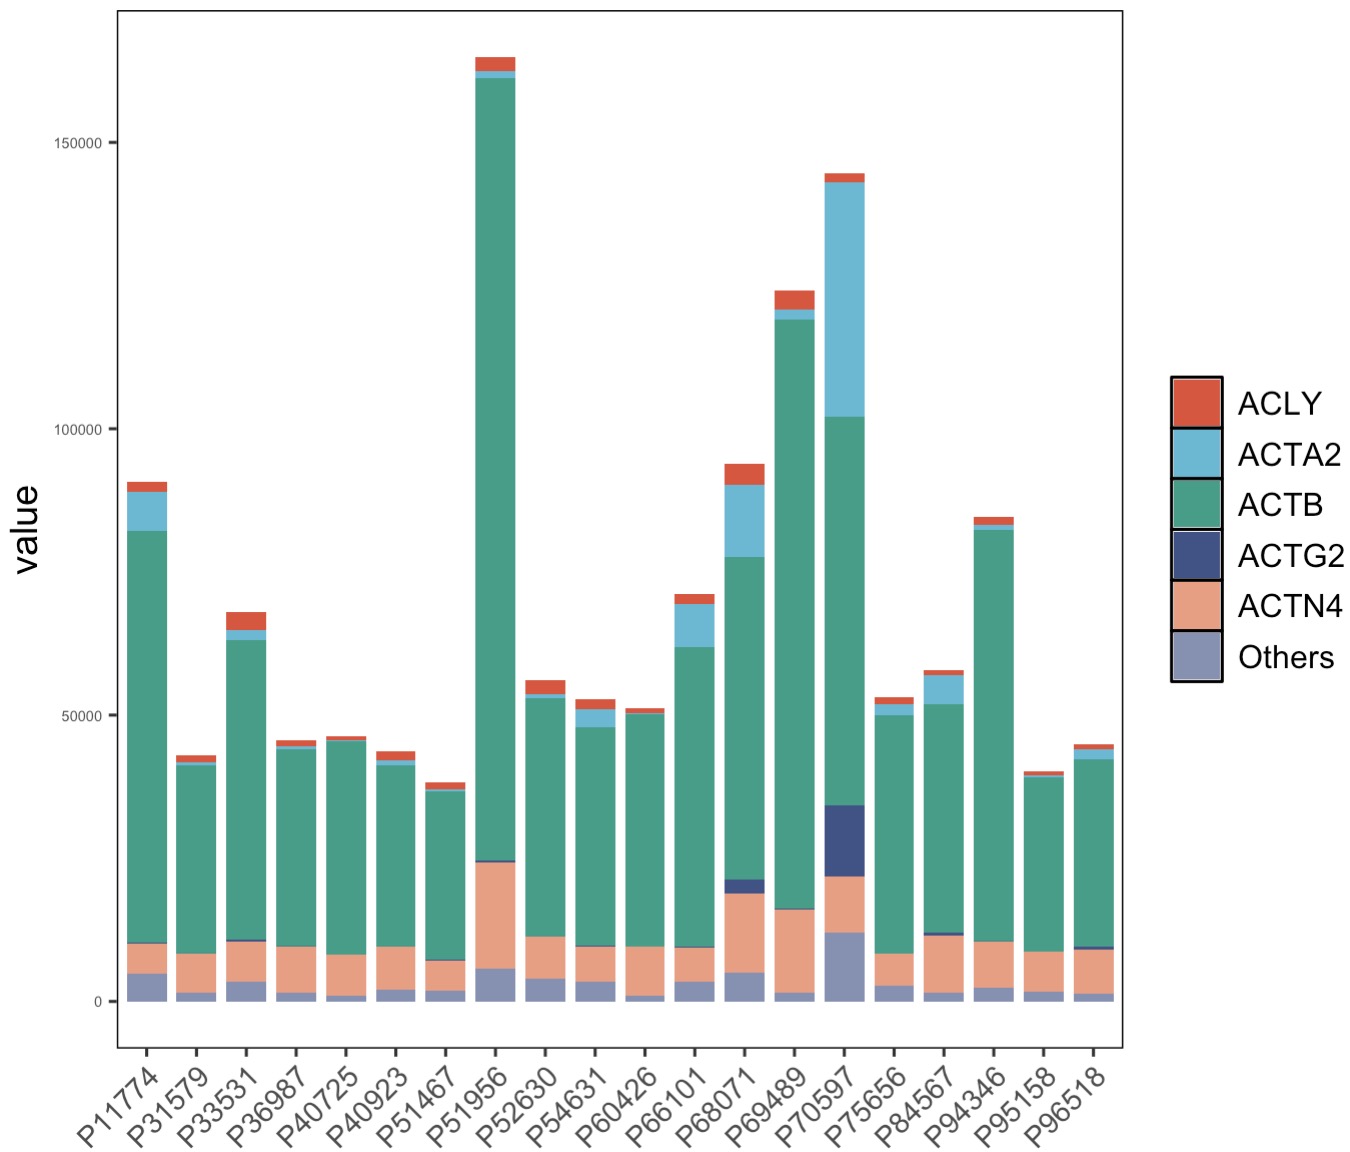
8.9.2 差异基因结构图
结构图可用于展现基因组学Top特征的分布情况。
🏷️示例:绘制差异基因中表达最高的前5名。
MAE |>
  EMP_assay_extract('host_gene') |>
  EMP_diff_analysis(method = 'deseq2',.formula = ~Group) |>
  EMP_filter(feature_condition = pvalue < 0.05) |>
  EMP_structure_plot(top_num=5)